Candlestick patterns are important tools used by traders to analyze price movements and make informed decisions. Let us see how candlestick patterns work.
Explanation Of Candlestick Charts
Candlestick charts are a popular form of charting used in technical analysis to visualize price movements of financial assets, including Bitcoin. They display price data over a specified period, such as minutes, hours, days, or weeks. Each candlestick on the chart represents the price movement during that specific time frame. The components of a candlestick include the body, which represents the price range between the opening and closing prices, and the wicks (shadows), which indicate the highest and lowest prices reached during that period.
Importance Of Candlestick Patterns In Technical Analysis
Candlestick patterns play a crucial role in technical analysis by providing insights into market sentiment and potential price reversals. Traders use these patterns to make informed decisions about buying or selling assets. These patterns often signal shifts in supply and demand dynamics and can help predict the direction of price movements. By recognizing recurring patterns, traders can identify potential trading opportunities and manage risk more effectively.
The Link Between Human Psychology And Candlestick Patterns
Candlestick patterns are rooted in the idea that market prices are influenced by human emotions and psychology. Each candlestick reflects the battle between buyers and sellers, representing moments of uncertainty, fear, greed, and optimism. For instance, a long bullish candle may indicate strong buying interest and optimism among traders, while a long bearish candle could reflect widespread selling and fear. Patterns like doji candles (where open and close prices are close together) can signify indecision in the market. Understanding these patterns allows traders to tap into the collective psychology of market participants.
Basic Candlestick Components
Body of the Candlestick
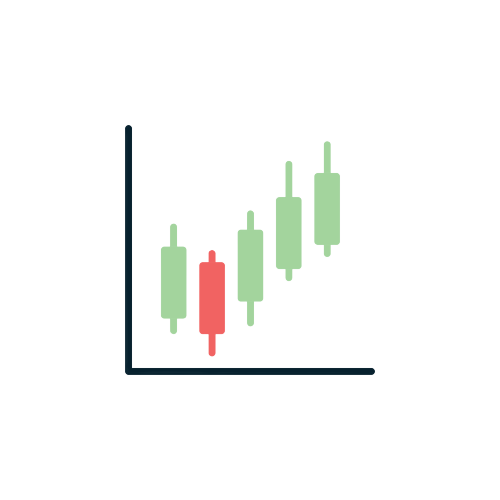
The body of a candlestick represents the price range between the opening and closing prices during a specific period. It is typically colored, with the color indicating whether the candlestick is bullish or bearish. In many charting platforms, a bullish candlestick (where the closing price is higher than the opening price) is often represented with a green or white body, while a bearish candlestick (where the opening price is higher than the closing price) is represented with a red or black body.
The length of the body provides information about the strength of the price movement. A long body indicates a significant price movement, while a short body suggests a more muted price change.
Wick (or Shadow) of The Candlestick

The wick, also known as the shadow, is the thin lines that extend above and below the body of the candlestick. The wicks represent the highest and lowest prices reached during the specified period. The upper wick extends from the top of the body to the high price, while the lower wick extends from the bottom of the body to the low price.
The length of the wicks provides insights into price volatility and the trading range within the period. Longer wicks indicate greater price fluctuations, while shorter wicks suggest more stable price movements.
Open, High, Low, and Close Prices
Open Price: The open price is the price at which the asset started trading during the period represented by the candlestick. It is marked by the left side of the candle’s body (for bullish candles) or the right side (for bearish candles).
High Price: The high price is the highest price reached during the specified period and is indicated by the upper end of the upper wick.
Low Price: The low price is the lowest price reached during the period and is indicated by the lower end of the lower wick.
Close Price: The close price is the final price at which the asset is traded during the period. It is marked by the right side of the candle’s body (for bullish candles) or the left side (for bearish candles).
Bullish Candlestick Patterns
A. Hammer:
Characteristics:
The hammer pattern consists of a single candlestick. The body is relatively small and located at the upper end of the trading range. The lower wick is at least two times longer than the body and doesn’t have an upper wick or a very short upper wick. The hammer resembles a hammer’s handle, hence the name.
Interpretation:
The hammer pattern suggests a potential reversal from a downtrend to an uptrend. The long lower wick indicates that sellers pushed the price significantly lower during the Crypto trading period, but buyers managed to regain control and push the price back up. The small body near the top signals that buyers are gaining strength.
Trading Implications:
Traders may interpret a hammer as a bullish signal, especially when it forms after a prolonged downtrend. It’s advisable to wait for confirmation in the form of a bullish candle after the hammer, as the pattern alone doesn’t guarantee an immediate trend reversal. A close above the hammer’s high might signal further upward movement.
B. Bullish Engulfing:
Characteristics:
The bullish engulfing pattern consists of two candlesticks. The first candlestick is bearish, followed by a larger bullish candlestick. The bullish candle completely engulfs the body of the preceding bearish candle.
Interpretation:
The bullish engulfing pattern suggests a reversal from a downtrend to an uptrend. The pattern signifies a shift in market sentiment from bearish to bullish. The strength of the bullish candlestick’s body emphasizes the buying momentum.
Trading Implications:
Traders often see the bullish engulfing pattern as a strong bullish signal, especially when it appears after a downtrend. Like with other patterns, waiting for confirmation (such as a subsequent bullish candle) can increase the reliability of the signal. Traders might consider buying or entering long positions based on this pattern.
C. Piercing Line:
Characteristics:
The piercing line pattern involves two candlesticks. The first candlestick is bearish, followed by a bullish candlestick. The bullish candle opens below the low of the previous bearish candle and closes above its midpoint.
Interpretation:
The piercing line pattern indicates a potential reversal from a downtrend to an uptrend. The pattern shows that after opening lower, buyers managed to push the price up significantly, penetrating the bearish candle’s territory.
Trading Implications:
The piercing line is seen as a moderately strong bullish signal, but traders may want to confirm with additional indicators or patterns. Waiting for a bullish confirmation candle can improve the reliability of the signal. Traders might consider buying or entering long positions based on this pattern.
These bullish candlestick patterns offer insights into potential shifts in market sentiment, providing traders with valuable information for making informed trading decisions. However, it’s important to note that no pattern is foolproof, and it’s recommended to use these patterns in conjunction with other technical analysis tools and risk management strategies.
Bearish Candlestick Patterns
A. Shooting Star:
Characteristics:
The shooting star pattern consists of a single candlestick. The upper wick is at least twice as long as the body. The body is relatively small and located at the lower end of the trading range. There may be little to no lower wick.
Interpretation:
The shooting star pattern suggests a potential reversal from an uptrend to a downtrend. The long upper wick indicates that buyers initially pushed the price higher during the trading period, but sellers regained control and pushed the price back down. The small body near the bottom signals weakening bullish momentum.
Trading Implications:
Traders often view the shooting star as a bearish reversal signal, especially if it forms after a prolonged uptrend. Confirmation in the form of a bearish candle after the shooting star can increase the reliability of the pattern. A close below the shooting star’s low might signal further downward movement.
B. Bearish Engulfing:
Characteristics:
The bearish engulfing pattern involves two candlesticks. The first candlestick is bullish, followed by a larger bearish candlestick. The bearish candle completely engulfs the body of the preceding bullish candle.
Interpretation:
The bearish engulfing pattern suggests a reversal from an uptrend to a downtrend. The pattern reflects a shift in market sentiment from bullish to bearish. The strength of the bearish candlestick’s body highlights the selling pressure.
Trading Implications:
Traders often consider the bearish engulfing pattern as a strong bearish signal, especially when it occurs after an uptrend. Confirmation, such as a subsequent bearish candle, can enhance the pattern’s credibility. Traders might contemplate selling or entering short positions based on this pattern.
C. Dark Cloud Cover:
Characteristics:
The dark cloud cover pattern involves two candlesticks. The first candlestick is bullish, followed by a bearish candlestick. The bearish candle opens above the high of the previous bullish candle and closes below its midpoint.
Interpretation:
The dark cloud cover pattern indicates a potential reversal from an uptrend to a downtrend. The pattern shows that after opening higher, sellers managed to push the price down considerably, challenging the bullish momentum.
Trading Implications:
The dark cloud cover is seen as a moderately strong bearish signal, but traders may want to use additional indicators for confirmation. Waiting for a bearish confirmation candle can enhance the reliability of the signal. Traders might consider selling or entering short positions based on this pattern.
These bearish candlestick patterns provide insights into potential shifts in market sentiment, giving traders valuable information to help them make informed trading decisions. However, it’s crucial to remember that no pattern guarantees a specific outcome, and traders should use these patterns in conjunction with other technical analysis tools and risk management strategies.
Continuation Candlestick Patterns
A. Three White Soldiers:
Characteristics:
The three white soldiers’ pattern involves three consecutive bullish candlesticks. Each candlestick has a larger body than the previous one. There are minimal or no wicks, indicating strong buying pressure.
Interpretation:
The three white soldiers’ pattern suggests a continuation of an existing uptrend. The consecutive bullish candles signify sustained buying momentum. It often indicates increased confidence among buyers.
Trading Implications:
Traders may interpret this pattern as a strong bullish continuation signal. It suggests that the uptrend is likely to persist, making it a potential opportunity for trend-following strategies.
B. Three Black Crows:
Characteristics:
The three black crows pattern consists of three consecutive bearish candlesticks. Each candlestick has a larger body than the previous one. There are minimal or no wicks, indicating strong selling pressure.
Interpretation:
The three black crows pattern suggests a continuation of an existing downtrend. The consecutive bearish candles indicate sustained selling momentum. It often signals increasing bearish sentiment.
Trading Implications:
Traders may interpret this pattern as a strong bearish continuation signal. It suggests that the downtrend is likely to persist, making it a potential opportunity for trend-following strategies.
Reversal Candlestick Patterns
A. Evening Star:
Characteristics:
The evening star pattern involves three candlesticks. The first is a large bullish candle. The second is a small-bodied candle that may be bullish or bearish. The third is a large bearish candle that closes below the midpoint of the first candle.
Interpretation:
The evening star pattern indicates a potential reversal from an uptrend to a downtrend. The pattern suggests a loss of bullish momentum and the emergence of selling pressure.
Trading Implications:
Traders may interpret the evening star as a strong bearish reversal signal. It suggests that the uptrend is losing steam and a trend reversal might occur. Confirmation with further bearish price action can enhance the reliability of the signal.
B. Morning Star:
Characteristics:
The morning star pattern involves three candlesticks. The first is a large bearish candle. The second is a small-bodied candle that may be bullish or bearish. The third is a large bullish candle that closes above the midpoint of the first candle.
Interpretation:
The morning star pattern indicates a potential reversal from a downtrend to an uptrend. The pattern suggests a loss of bearish momentum and the emergence of buying pressure.
Trading Implications:
Traders may interpret the morning star as a strong bullish reversal signal. It suggests that the downtrend is weakening and a trend reversal might occur. Confirmation with further bullish price action can enhance the reliability of the signal.
C. Tweezer Tops and Bottoms:
Characteristics:
Tweezer tops involve two candlesticks with similar highs. Tweezer bottoms involve two candlesticks with similar lows. The first candlestick is usually longer, followed by a shorter one with a small or no body.
Interpretation:
Tweezer tops suggest potential bearish reversals when they occur at the end of an uptrend. Tweezer bottoms suggest potential bullish reversals when they occur at the end of a downtrend. These patterns indicate potential reversals due to the failure of price to make further progress in the same direction.
Trading Implications:
Traders may interpret tweezer tops and bottoms as possible reversal signals, but they might require additional confirmation. Confirmation through subsequent price action or technical indicators can help validate the reversal possibility.
Complex Candlestick Patterns
A. Bullish Harami:
Characteristics:
The bullish harami pattern involves two candlesticks. The first is a large bearish candle. The second is a smaller bullish candle fully contained within the body of the first candle.
Interpretation:
The bullish harami suggests a potential bullish reversal after a downtrend. The smaller second candle indicates diminishing selling pressure and the potential emergence of buying interest.
Trading Implications:
Traders may interpret the bullish harami as a possible trend reversal signal. It indicates that the downtrend could be losing momentum, but additional confirmation is often recommended.
B. Bearish Harami:
Characteristics:
The bearish harami pattern involves two candlesticks. The first is a large bullish candle. The second is a smaller bearish candle fully contained within the body of the first candle.
Interpretation:
The bearish harami suggests a potential bearish reversal after an uptrend. The smaller second candle indicates waning buying pressure and the potential emergence of selling interest.
Trading Implications:
Traders may interpret the bearish harami as a possible trend reversal signal. It indicates that the uptrend might be losing momentum, but additional confirmation is often recommended.
C. Doji:
Characteristics:
A doji pattern occurs when the open and close prices are very close or equal, resulting in a small or no body. Doji patterns can have different shapes, such as standard doji, long-legged doji, gravestone doji, and dragonfly doji.
Interpretation:
Doji patterns suggest indecision in the market, as neither buyers nor sellers have a clear advantage. Depending on the context, they can signal potential reversals or trend continuation.
Trading Implications:
Traders often see doji patterns as potential reversal signals when they appear after a strong trend. Confirmation through subsequent price action or indicators is important due to their ambiguous nature.
Applying Candlestick Patterns To Bitcoin Trading
Combining Candlestick Patterns with Other Technical Indicators:
Traders often use candlestick patterns in conjunction with other technical indicators, such as moving averages, RSI, MACD, and trendlines, to enhance the accuracy of their predictions.
The combination of patterns and indicators can provide a more comprehensive view of market conditions and potential price movements.
Identifying Key Support and Resistance Levels:
Candlestick patterns can help identify key support and resistance levels on a price chart.
These levels can act as barriers to price movement and provide insights into potential entry and exit points for trades.
Timeframes for Trading Decisions (Short-Term vs. Long-Term)
Different candlestick patterns may hold more significance in different timeframes. Short-term traders may focus on patterns that play out over shorter periods, while long-term traders might consider patterns on longer timeframes for more sustainable trends.
Applying candlestick patterns to Bitcoin trading involves understanding how these patterns interact with other technical tools and considering factors like timeframes and market context. Remember that successful trading requires continuous practice, risk management, and adaptability to changing market conditions.